In January of 2019 we launched the On-call Compensation Survey, which aimed to surface how compensation for on-call is being applied across the Tech/IT sector. Thanks to the 300+ people who responded, we have a dataset which we hope will make it easy for those who manage on-call to make better decisions, and for those who are on-call to have something to cite when asking to be compensated fairly.
The Data
Of the people who responded, approximately 200 were willing to have their responses to be shared publicly. This dataset is available here.
The Results
In this section we analyse the responses, providing aggregated views of quantitative data and themes which have emerged from qualitative.
We received 314 responses (at the time of writing of this post) which we used in this analysis - if you use the shared dataset above, you will end up with different results.
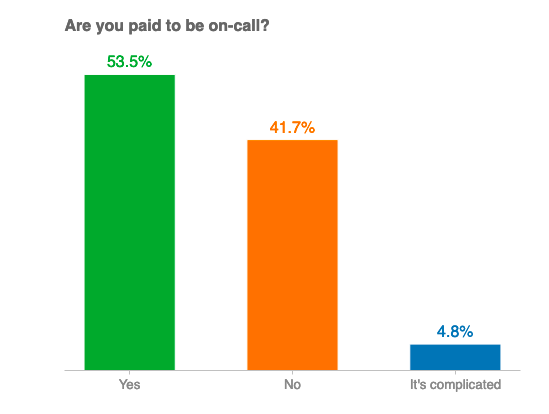
First and foremost, we see that just over half of the people who have on-call responsibilities are paid to carry them out:
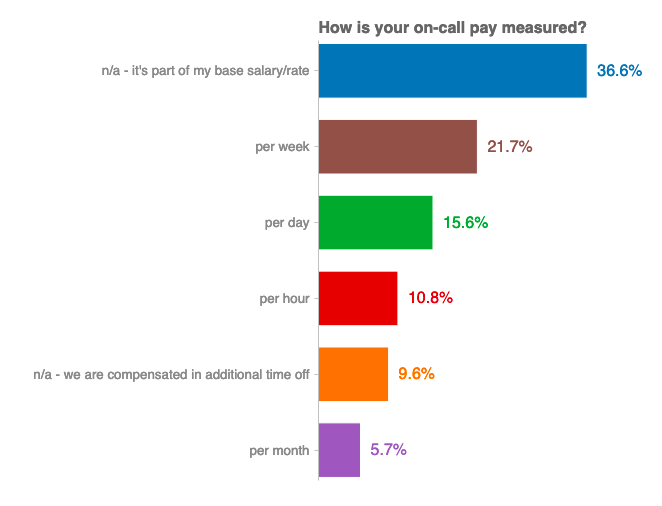
We then see that on-call pay is often expressed in different ways - some people have hourly rates, some people daily, others are paid in additional time off:
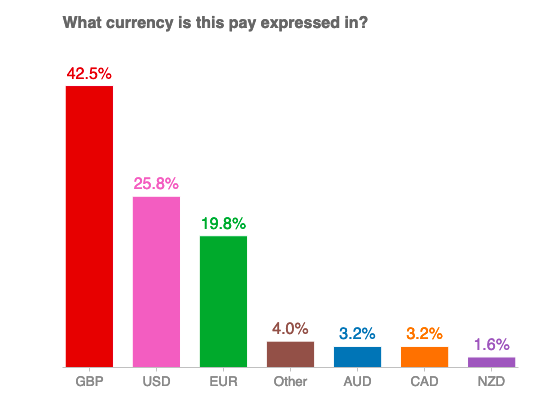
We also gathered the currency that pay was expressed in, to help us to make a better comparison between countries. Shout out to the people in the “Other” category - we received data from people in Brazil, India, Poland, Romania, Switzerland, Singapore, Denmark and Hungary. The majority of responses coming from the UK is mainly a reflection of the networks that we (the survey creators) were able to spread this survey too. Over time we’d hope to reach a larger global audience!
Having currency data allowed us to make a rough comparison between compensation levels. We used some very rudimentary (and almost probably partially inaccurate!) conversions to normalize compensation to EUR per week. We chose EUR because it was the only available base currency on the free tier of the currency conversion API used!
We had to strip out a small number of outliers - as you can imagine, an hourly rate probably paid only during an incident doesn’t translate correctly to a weekly rate!
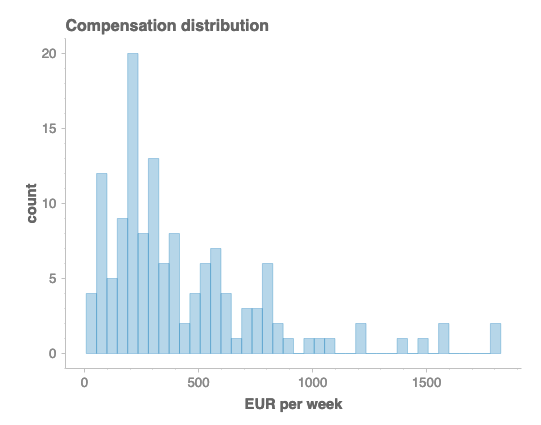
Here we see that the bulk of responses landed in the 0-500 per week range, which was not totally unexpected. It’s probably worth sharing the breakdowns of each pay “type” (hourly/daily/weekly/monthly) converted into EUR, but not normalized to weekly, which may give a slightly more useful picture for people trying to understand where their pay is relative to others:
| (all in EUR) | Hourly | Daily | Weekly | Monthly |
|---|---|---|---|---|
| mean | 24 | 107.1 | 417.44 | 553.74 |
| std | 41.31 | 118.08 | 219.99 | 215.17 |
| min | 0.2 | 11.44 | 49.99 | 218.18 |
| 25% | 3.61 | 37.42 | 227.66 | 416.61 |
| 50% | 10.61 | 62.64 | 382.12 | 500 |
| 75% | 39.56 | 113.83 | 569.15 | 750 |
| max | 400 | 529.49 | 1050 | 1000 |
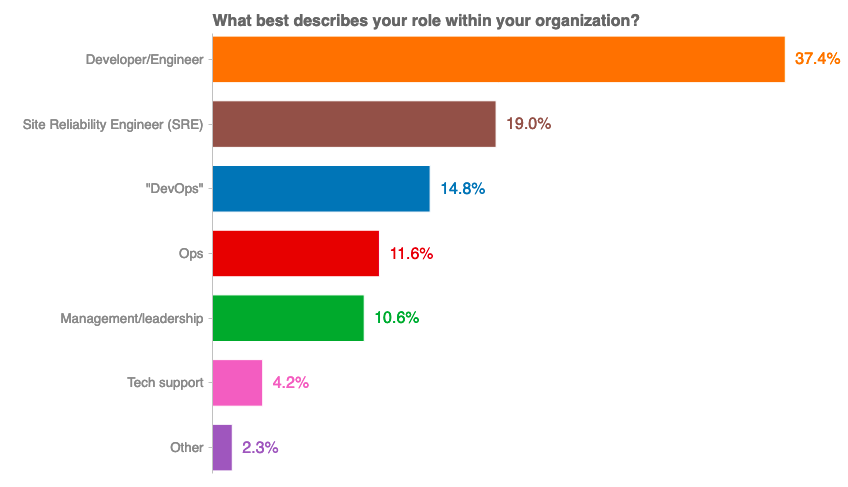
We also looked at people’s roles within an organisation. To the consultants, product managers and testers lumped under “other” - we see you, and were both surprised and delighted to see a wider range of roles participating in on-call:
This let us explore whether there was a correlation between roles and compensation:
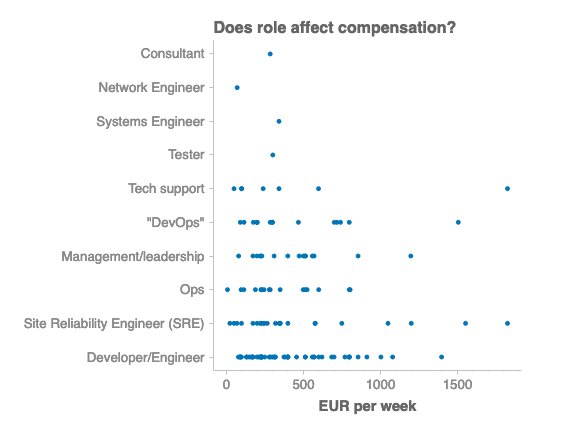
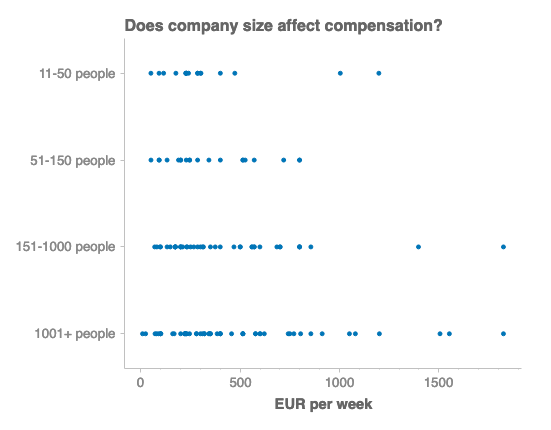
At this volume of responses, nothing particularly conclusive stood out. We saw a similar pattern (or lack thereof) between company size and compensation:
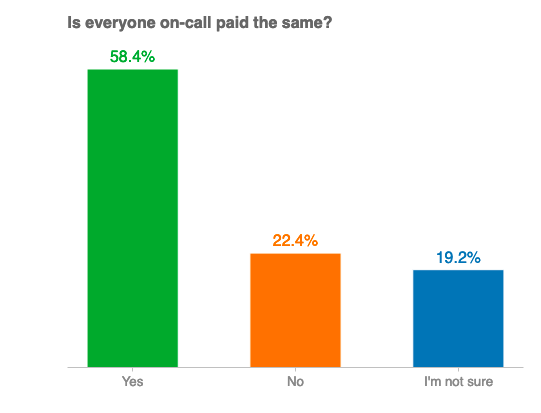
It was also interesting to see that ~20% of respondents didn’t know whether everyone on-call was compensated the same amount, suggesting that better transparency around on-call pay could reduce that proportion:
What the numbers/graphs don’t show:
One theme that clearly emerged from this survey was that on-call is structured and compensated in an astonishing amount of different ways. For example:
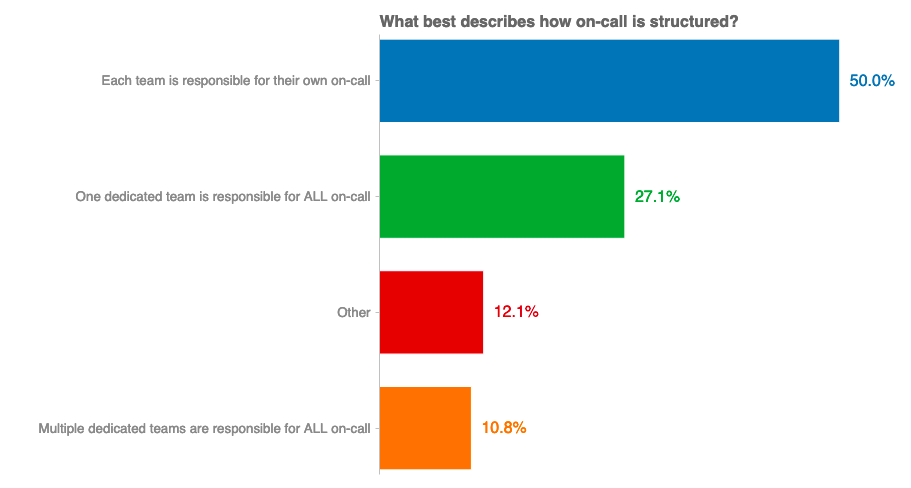
Within “Other” is a myriad of different support models, ranging from formal 1st/2nd/3rd line support models to “the engineering manager and software manager are always on-call”.
We also realised that the survey failed to capture more nuanced compensation structures - for example, some respondents were not paid anything unless an incident occurred, or would be paid a different amount based on whether they were designated as primary or secondary on-call. A lot of this detail is contained in final column of the raw dataset, and definitely worth a quick scan.
Notes on methodology
We learned a lot from this first run: mainly that designing a survey to capture valuable quantitative AND qualitative data is not easy. We got some great feedback both via the survey and on Twitter, and look forward to giving this another go in the next 6-12 months. The success of other studies such as the annual StackOverflow survey, Puppet’s State of DevOps survey (among many others) shows that there is potential to gather actionable data from the community.
If anyone is interested in doing their own analysis, please do! This data was crunched (or, at this volume, lightly chewed) with Jupyter Notebook, Pandas, and Chartify. Please contact Spike if you have any questions about the specifics.
Thanks
We’d like to express our gratitude to everyone who took the time to share this data with us, some of whom are recognised below.

